Measuring Success
How we PROSPER
2023
METRIC 12
Non-Residential Development
Track the amount of non-residential development.
METRIC result
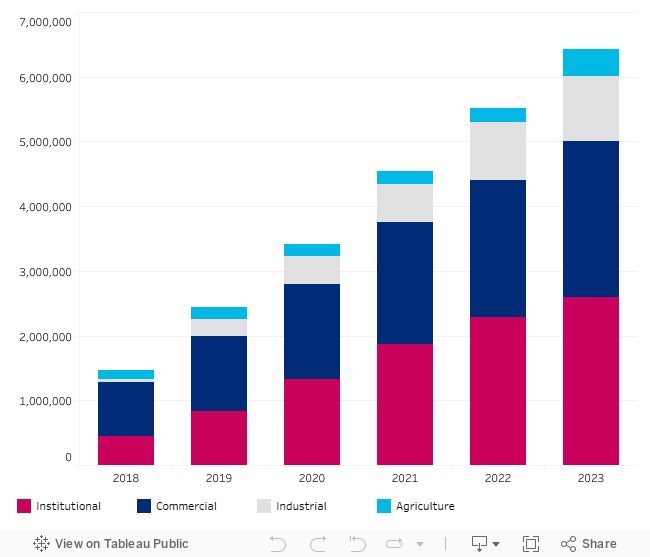
Over the past five years, there has been a significant increase in institutional and commercial development. Industrial development has been stable while agricultural development has been more muted.

Cumulative Development by Type (sq. ft.)
METRIC 13
Urban Center Prosperity
Monitor taxable assessments in urban centers to track economic and community prosperity.
METRIC result
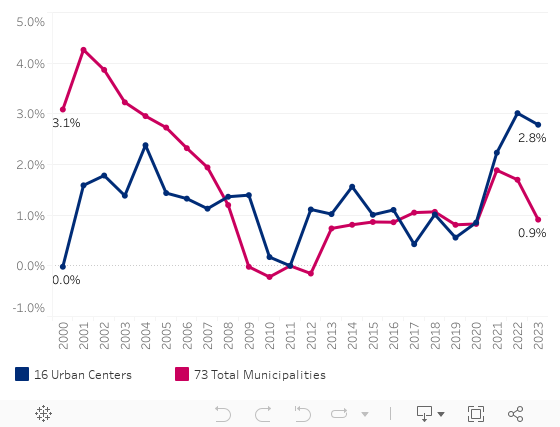
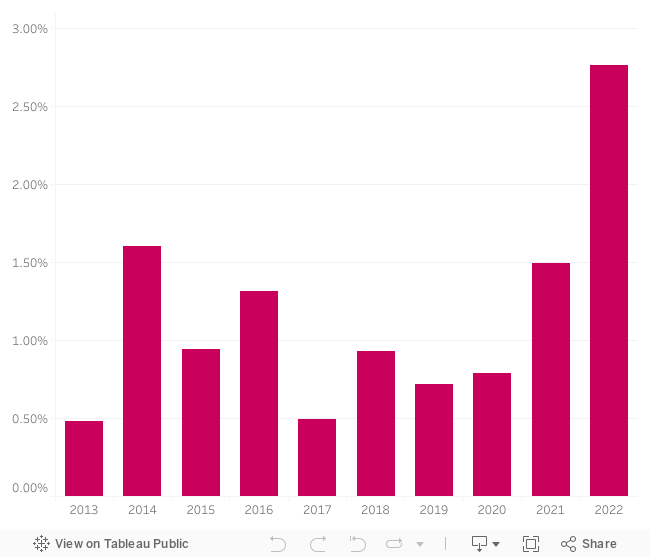
From 2000 to 2008, Urban Centers had a lower rate of increase in total assessed value than the 73 municipalities as a whole. From 2009 through 2019, total assessment on Urban Centers generally paralleled the county total. But since 2020, Urban Center assessment growth has exceeded the county as a whole, marking a reversal from conditions in the 2000s.

Annual % Change in Total Assessment
METRIC 14
Workforce Development Progress
Track the number of people assisted with employment training by the county.
METRIC result
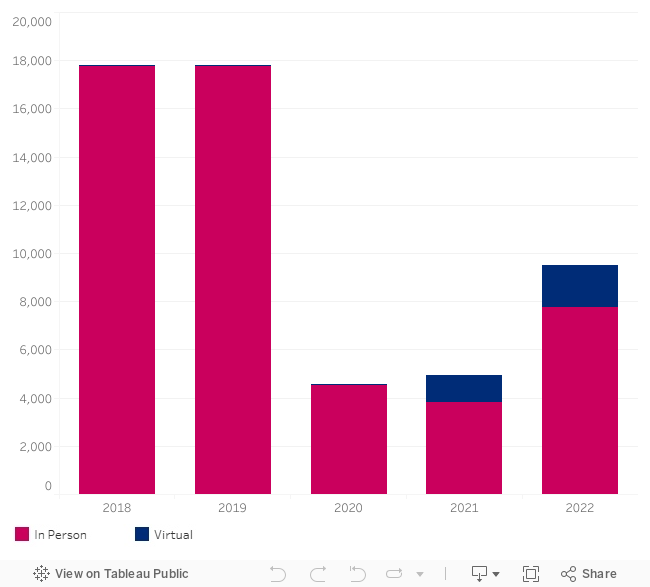
The COVID epidemic permanently altered the approach to workforce development programs in Chester County. In person visits to assistance centers plummeted, while virtual meetings became commonplace. Changes were then made to assure that opportunities for training remained viable.

Workers who visited PA Career Link (calendar year)
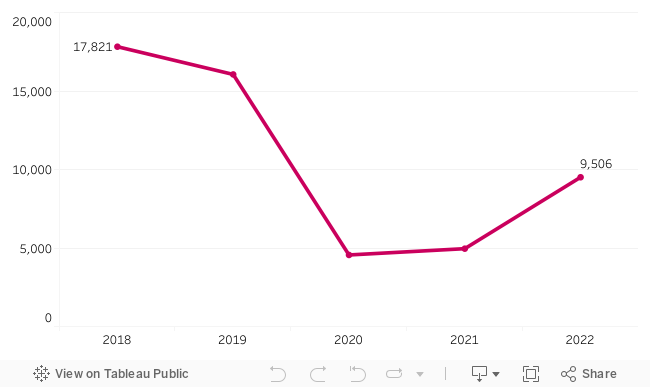
* Virtual meetings were not held prior to 2021.
** Calendar year data yet available.
2022
METRIC 12
Non-Residential Development
Track the amount of non-residential development.
METRIC result
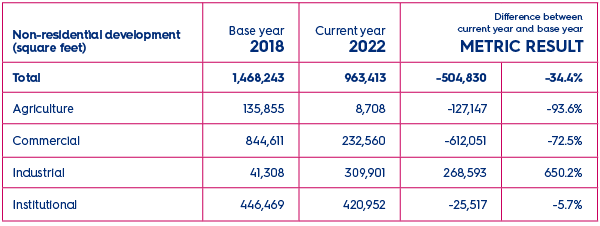
During 2022, a total of 963,413 square feet of non-residential development was built in the county.
The recently completed John Rock Building in Sadsbury Township be used for manufacturing pallets.
METRIC 13
Urban Center Prosperity
Monitor taxable assessments in urban centers to track economic and community prosperity.
METRIC result
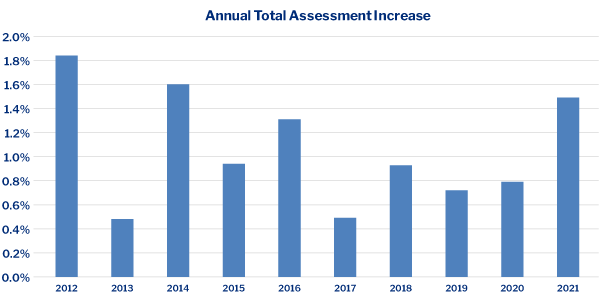
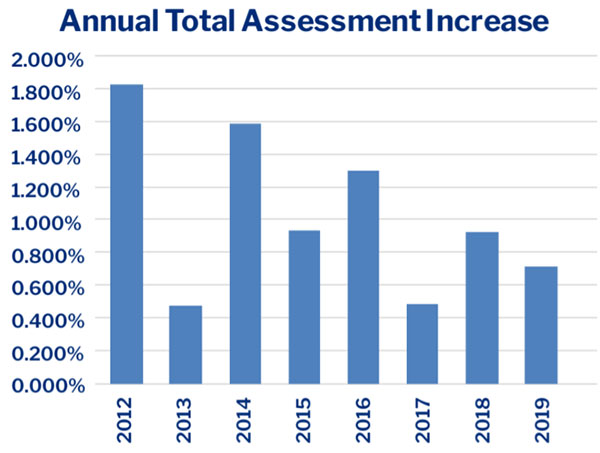
During 2022, the annual increase in total assessment for all the county's urban centers combined was 2.67%, while the base year was 0.927%.

Annual Total Assessment Increase
METRIC 14
Workforce Development Progress
Track the number of people assisted with employment training by the county.
METRIC result
During 2022, a total of 9,506 workers visited the county office of PACareerLink, a cooperative program where job seekers and employers share access to a wide array of job training, education, and employment services. This represents a drop of 8,315 (or 46.7%) relative to the base year.

Visitors In Person versus Virtual
2021
METRIC 12
Non-Residential Development
Track the amount of non-residential development.
METRIC result
During the current year (2021), a total of 1,132,151 square feet of non-residential development was built in the county. This represents a drop of 336,092 square feet relative to the base year (2018). This change was largely due to a reduction in commercial development.
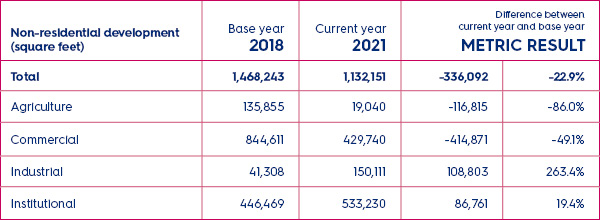
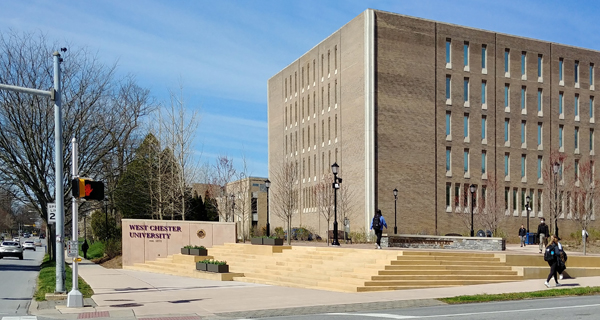
Non-residential development is typically commercial and industrial. But it can also include agriculture structures, additions to existing buildings, and institutional land uses like the recent reconstruction of the commons at West Chester University.
METRIC 13
Urban Center Prosperity
Monitor taxable assessments in urban centers to track economic and community prosperity.
METRIC result
During the current year (2021), the annual increase in total assessment for all the county's urban centers combined was 1.490%, while the base year was 0.927%.

METRIC 14
Workforce Development Progress
Track the number of people assisted with employment training by the county.
METRIC result
During the current year (2021), a total of 4,857 workers visited the county office of PACareerLink, a cooperative program where job seekers and employers share access to a wide array of job training, education, and employment services. This represents a drop of 12,864 (or 72.2%) relative to the base year (2018).


In response to the pandemic, the PA CareerLink shifted to mostly remote communications with job seekers.
2020
METRIC 12
Non-Residential Development
Track the amount of non-residential development.
METRIC result
During the current year (2020), a total of 961,413 square feet of non-residential development was built in the county. This represents a drop of 506,830 square feet relative to the base year (2018). This change was largely due to a reduction in commercial development.

Most new non-residential development is commercial. But it also includes industrial, institutional, agriculture structures, and additions to existing buildings.
METRIC 13
Urban Center Prosperity
Monitor taxable assessments in urban centers to track economic and community prosperity.
METRIC result
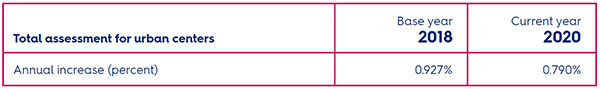
During the current year (2020), the annual increase in total assessment for all the county's urban centers combined was 0.790%, while the base year was 0.927%.

METRIC 14
Workforce Development Progress
Track the number of people assisted with employment training by the county.
METRIC result
During the current year (2020), a total of 4,556 workers visited the county office of PACareerLink, a cooperative program where job seekers and employers share access to a wide array of job training, education, and employment services. This represents a drop of 13,265 (or 74.4%) relative to the base year (2018).


In response to the pandemic, the PA CareerLink shifted to mostly remote communications with job seekers.
2019
METRIC 12
Non-Residential Development
Track the amount of non-residential development.
METRIC result
During the current year (2019), a total of 975,849 square feet of non-residential development was built in the county. This represents a drop of 492,394 square feet relative to the base year (2018). This change was largely due to a reduction in commercial development.
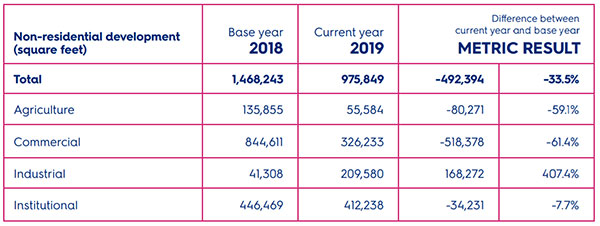

New non-residential construction can include construction on previously undeveloped land, construction on lots that previously contained structures, or additions to existing buildings.
METRIC 13
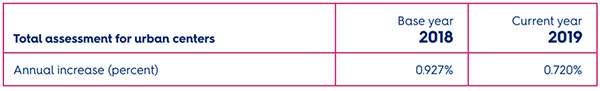
Urban Center Prosperity
Monitor taxable assessments in urban centers to track economic and community prosperity.
METRIC result
During the current year (2019), the annual increase in total assessment for all the county's urban centers combined was 0.720%, while the base year was 0.927%.
METRIC 14
Workforce Development Progress
Track the number of people assisted with employment training by the county.
METRIC result
During the current year (2019), a total of 16,055 workers visited the county office of PACareerLink, a cooperative program where job seekers and employers share access to a wide array of job training, education, and employment services. This represents a drop of 1,766 (or 9.9%) relative to the base year (2018).