Measuring Success
How we LIVE
2023
METRIC 8
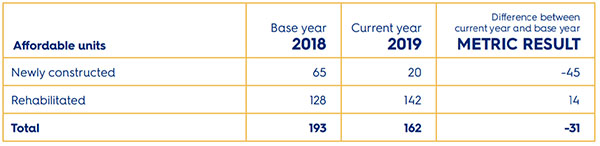
Affordable Housing Built
Track the number of built or rehabbed affordable units subsidized by the county.
METRIC result
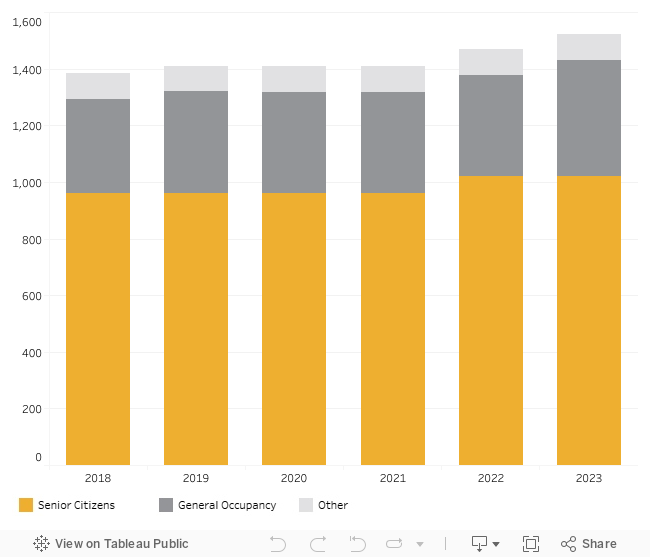
In recent years, affordable housing growth has become dominated by rental housing. Another recent trend is the increase in units reserved for seniors.

Affordable Housing Built and Rehabilitated
METRIC 9
Housing Diversity
Track the types of housing constructed in the county.
METRIC result
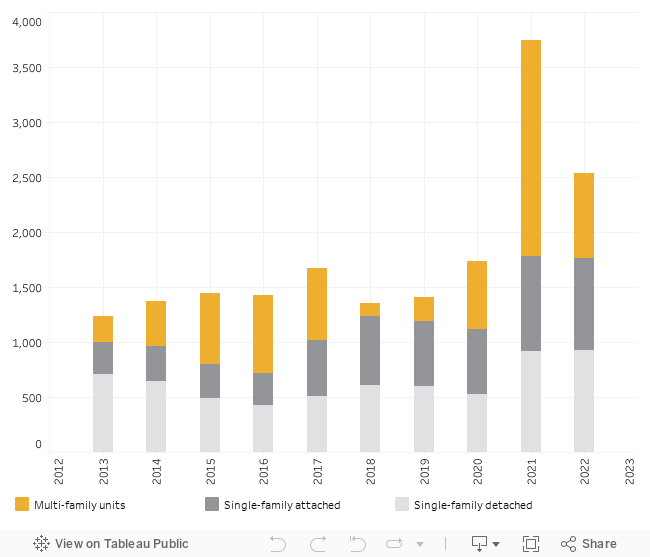
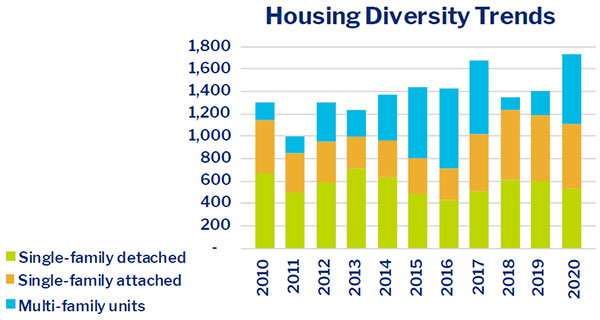
In 2014, the US Census reported that the total existing housing in Chester County was 62.5% single family detached, 17.8% attached, and 19.7% apartments. Thus, the housing types built in 2023 are far more diverse than the existing stock was ten years ago.

Housing Diversity Trends
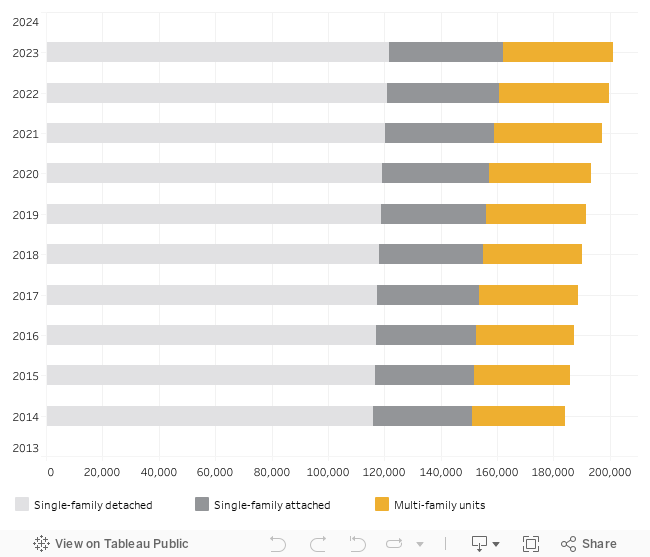
* Includes units commonly called townhouses and twins.
METRIC 10
Access to Parks
Monitor the percentage of residents living near public park and recreation facilities.
METRIC result
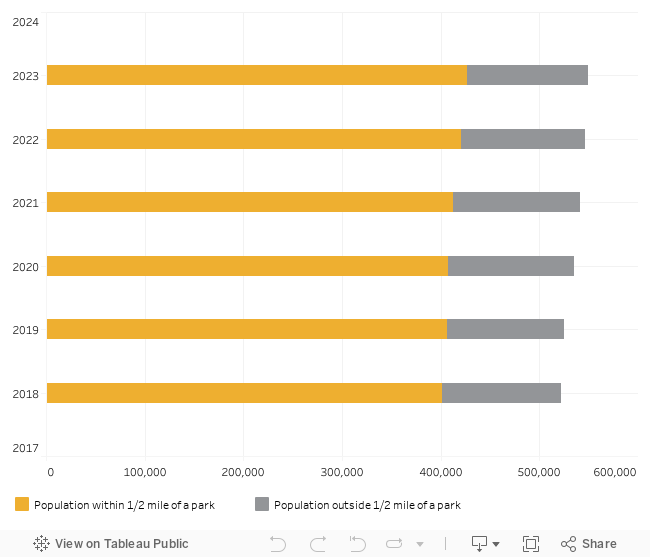
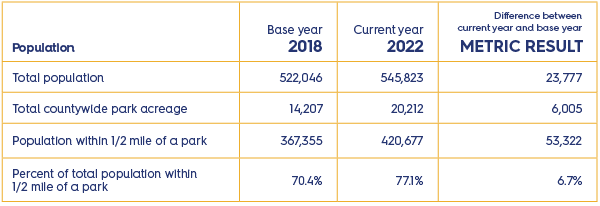
There has been a steady increase in the population within 1/2 mile of a park. Most of these people live in the higher density eastern parts of the county, which is also where new parkland is increasing.

METRIC 11
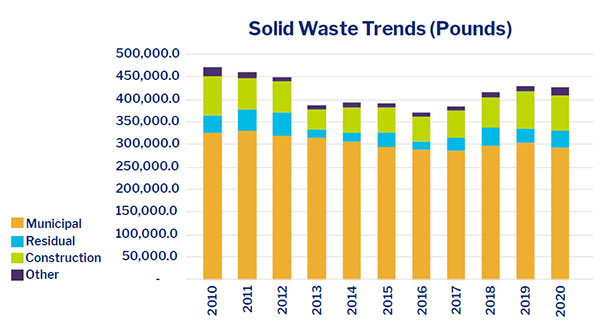
Solid Waste
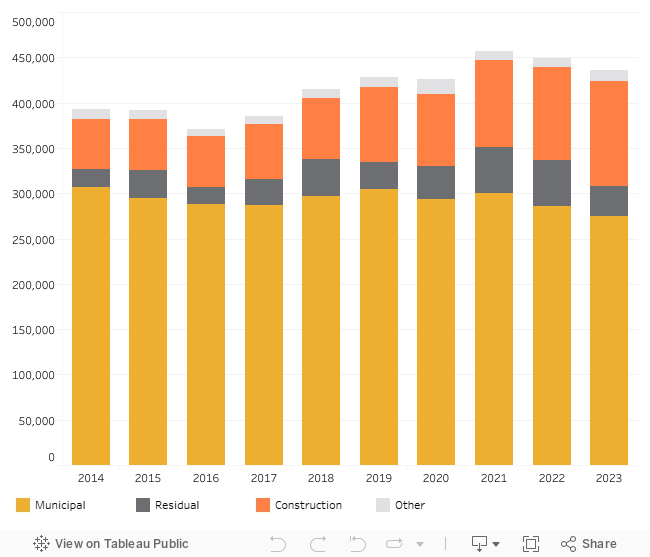
Track the amount of municipal waste per capita.
METRIC result
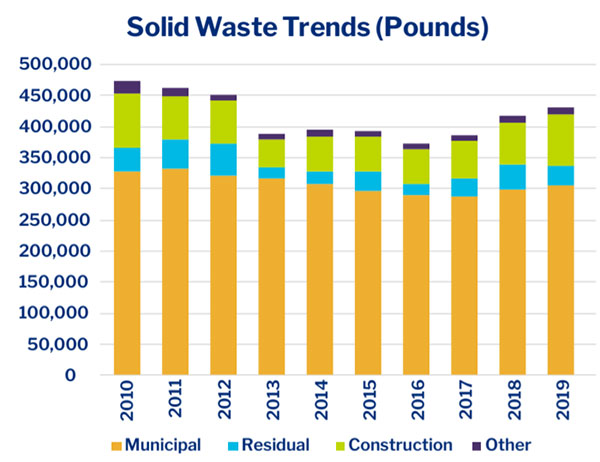
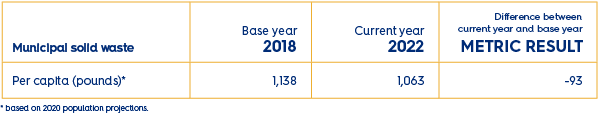
According to a 2021 study by the Pennsylvania Waste Industries Association, the state generates approximately 1,480 pounds of municipal waste per person every year. Since 2018, Chester County has ranged between 1,000 and 1,200 pounds per person.

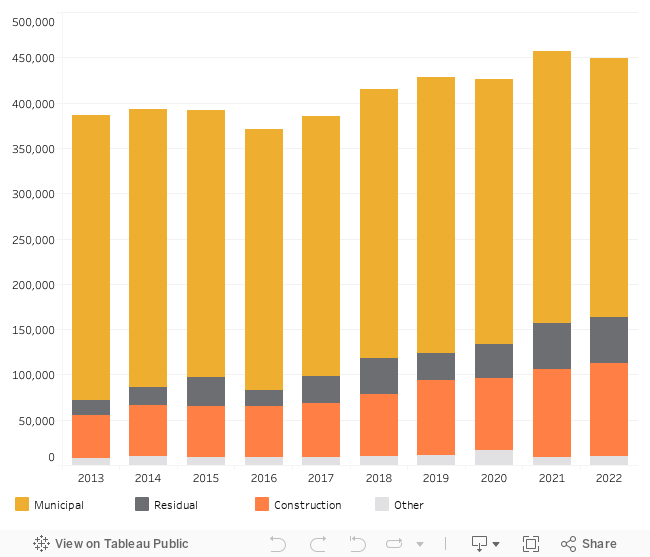
Solid Waste Trends (pounds)
* Based on 2020 population projections.
2022
METRIC 8
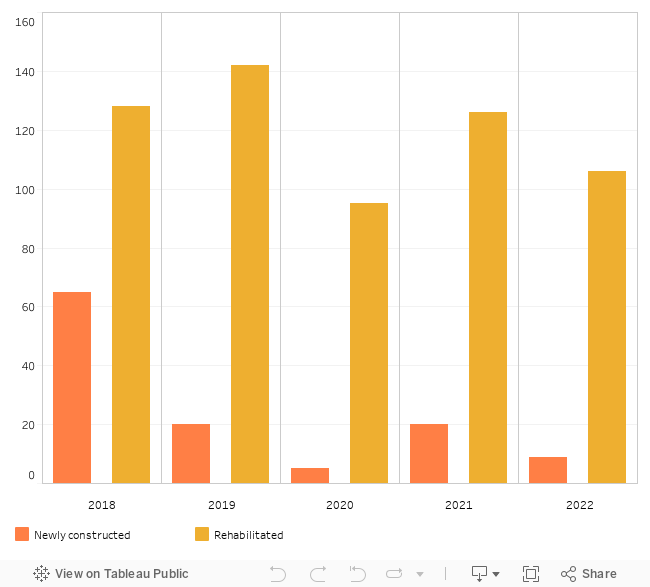
Affordable Housing Built
Track the number of built or rehabbed affordable units subsidized by the county.
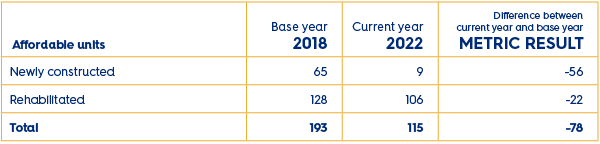
METRIC result
During 2022 a total of 115 affordable housing units, either newly built or existing rehabbed structures, were added to the market with financial assistance provided by the County Department of Community Development (DCD).
Affordable Housing Built and Rehabilitated
METRIC 9
Housing Diversity
Track the types of housing constructed in the county.
METRIC result
During 2022, a total of 2,537 units were built. Of these, 36.5% were single family detached, 33.0% were single family attached, and 30.5% were multi-family.

Housing Diversity Trends
METRIC 10
Access to Parks
Monitor the percentage of residents living near public park and recreation facilities.
METRIC result
During 2022, the estimated population within a 1/2 mile of the county's public parks and recreation facilities was 420,667. This represents an increase of 6.7% relative to the base year.

METRIC 11
Solid Waste
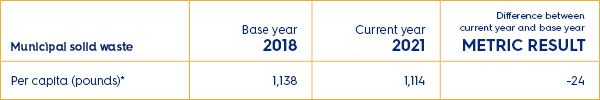
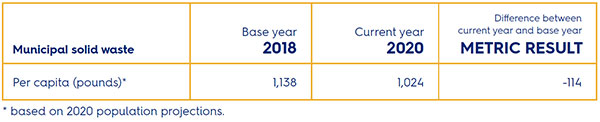
Track the amount of municipal waste per capita.
METRIC result
During 2022, Chester County's per capita municipal solid waste (commonly called household waste) was 1,138 pounds per person. This represents a decrease of 93 pounds relative to the base year.
Solid Waste Trends (pounds)
2021
METRIC 8
Affordable Housing Built
Track the number of built or rehabbed affordable units subsidized by the county.
METRIC result
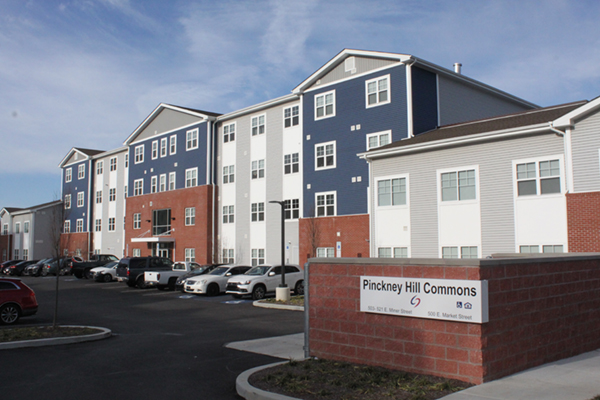
During the current year (2021), a total of 146 affordable housing units, either newly built or existing rehabbed structures, were added to the market with financial assistance provided by the County Department of Community Development (DCD).
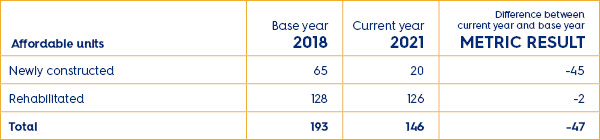
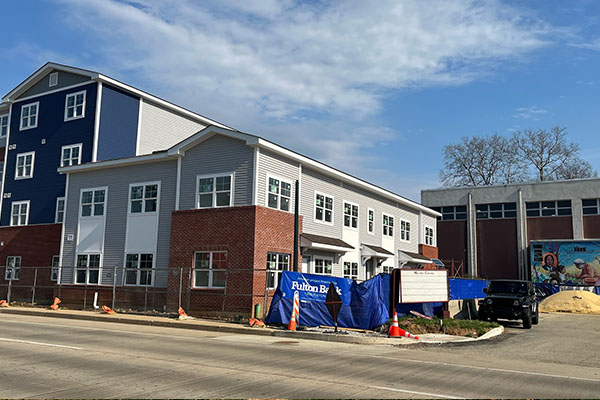
Last year, construction progressed on major affordable housing projects, like at the Melton Center.
METRIC 9
Housing Diversity
Track the types of housing constructed in the county.
METRIC result
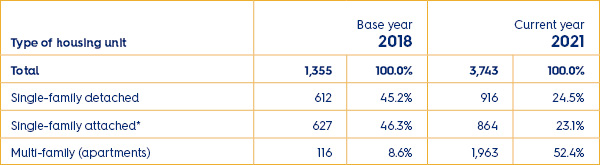
During the current year (2021), a total of 3,743 units were built, of which 916 (or 24.5%) were single family detached, 864 (or 23.1%) were single family attached, and 1,963 (or 52.4%) were multi-family.
METRIC 10
Access to Parks
Monitor the percentage of residents living near public park and recreation facilities.
METRIC result
During the current year (2021), a total of 3,743 units were built, of which 916 (or 24.5%) were single family detached, 864 (or 23.1%) were single family attached, and 1,963 (or 52.4%) were multi-family.
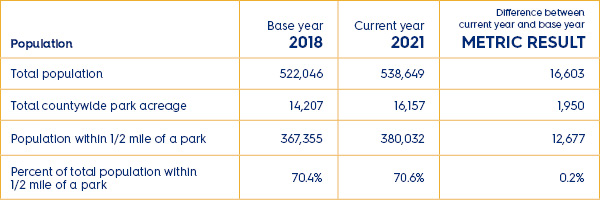
Many of the county's park and recreation facilities are located in the higher density, central and eastern portions of the county because that is where much of the population lives.
METRIC 11
Solid Waste
Track the amount of municipal waste per capita.
METRIC result
During the current year (2021), Chester County's per capita municipal solid waste (commonly called household waste) was 1,114 pounds per person. This represents a decrease of 24 pounds relative to the base year.
2020
METRIC 8
Affordable Housing Built
Track the number of built or rehabbed affordable units subsidized by the county.
METRIC result
During the current year (2020), a total of 100 affordable housing units, either newly built or existing rehabbed structures, were added to the market with financial assistance provided by the County Department of Community Development (DCD).
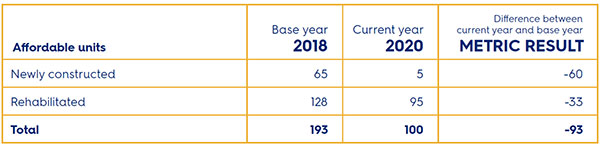
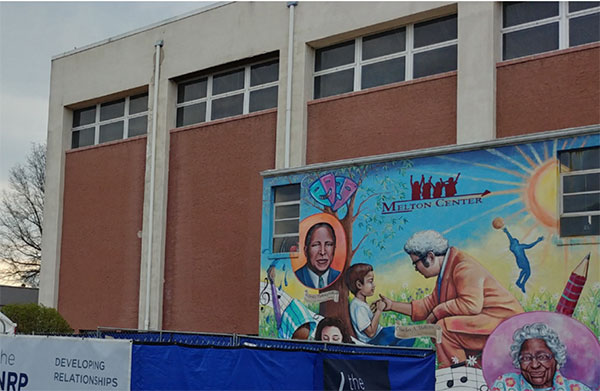
Last year, construction began on major affordable housing projects, like at the Melton Center.
METRIC 9
Housing Diversity
Track the types of housing constructed in the county.
METRIC result
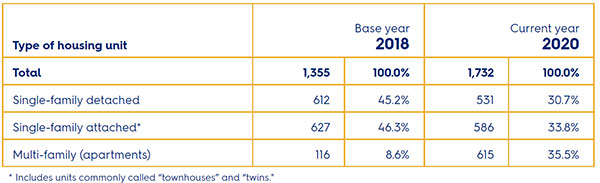
During the current year (2020), a total of 1,732 units were built, of which 531 (or 30.7%) were single family detached, 586 (or 33.8%) were single family attached, and 615 (or 35.5%) were multi-family.
METRIC 10
Access to Parks
Monitor the percentage of residents living near public park and recreation facilities.
METRIC result
During the current year (2020), the estimated population within a 1/2 mile of the county's public parks and recreation facilities was 381,831. This represents an increase of 14,477 relative to the base year (2018).
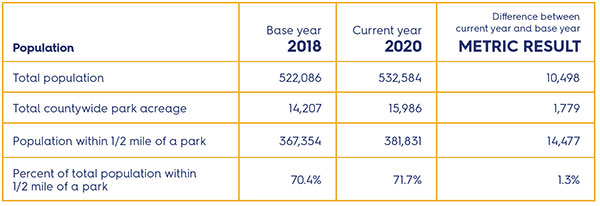
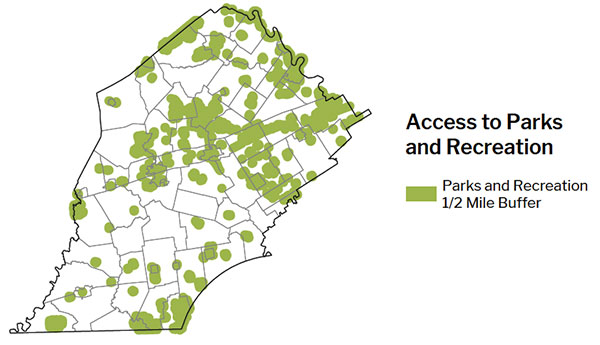
Many of the county's park and recreation facilities are located in the highter density, central and eastern portions of the county because that is where much of the population lives.
METRIC 11
Solid Waste
Track the amount of municipal waste per capita.
METRIC result
During the current year (2019), Chester County's per capita municipal solid waste (commonly called household waste) was 1,160 pounds per person. This represents an increase of 23 pounds (or 2.0%) relative to the base year.
2019
METRIC 8
Affordable Housing Built
Track the number of built or rehabbed affordable units subsidized by the county.
METRIC result
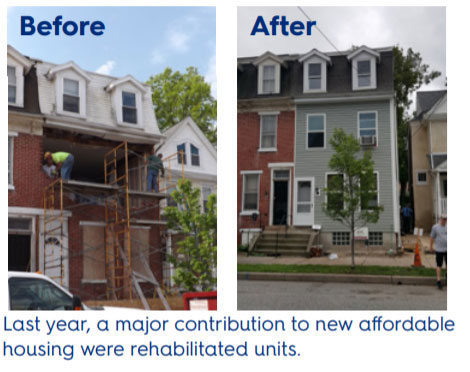
During the current year (2019), a total of 162 affordable housing units, either newly built or existing rehabbed structures, were added to the market with financial assistance provided by the County Department of Community Development (DCD).
METRIC 9
Housing Diversity
Track the types of housing constructed in the county.
METRIC result
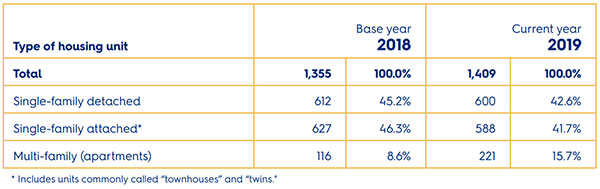
During the current year (2019), a total of 1,490 units were built, of which 600 (or 42.6%) were single family detached, 588 (or 41.7%) were single family attached, and 221 (or 15.7%) were multi-family.

METRIC 10
Access to Parks
Monitor the percentage of residents living near public park and recreation facilities.
METRIC result
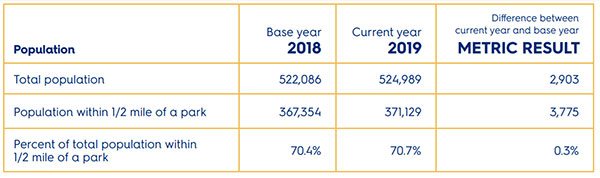
During the current year (2019), the estimated population within a 1/2 mile of the county's public parks and recreation facilities was 371,129. This represents an increase of 3,775 relative to the base year (2018).

METRIC 11
Solid Waste
Track the amount of municipal waste per capita.
METRIC result
During the current year (2019), Chester County's per capita municipal solid waste (commonly called household waste) was 1,160 pounds per person. This represents an increase of 23 pounds (or 2.0%) relative to the base year.